Your first ten minutes in the console
Exploring the console changes nothing, so look around freely. Only the response buttons on an incident (Acknowledge, Approve and the like) do anything, and Varqeni checks each one again before it acts.
AvailabilityAvailable to everyone with early access to Varqeni.
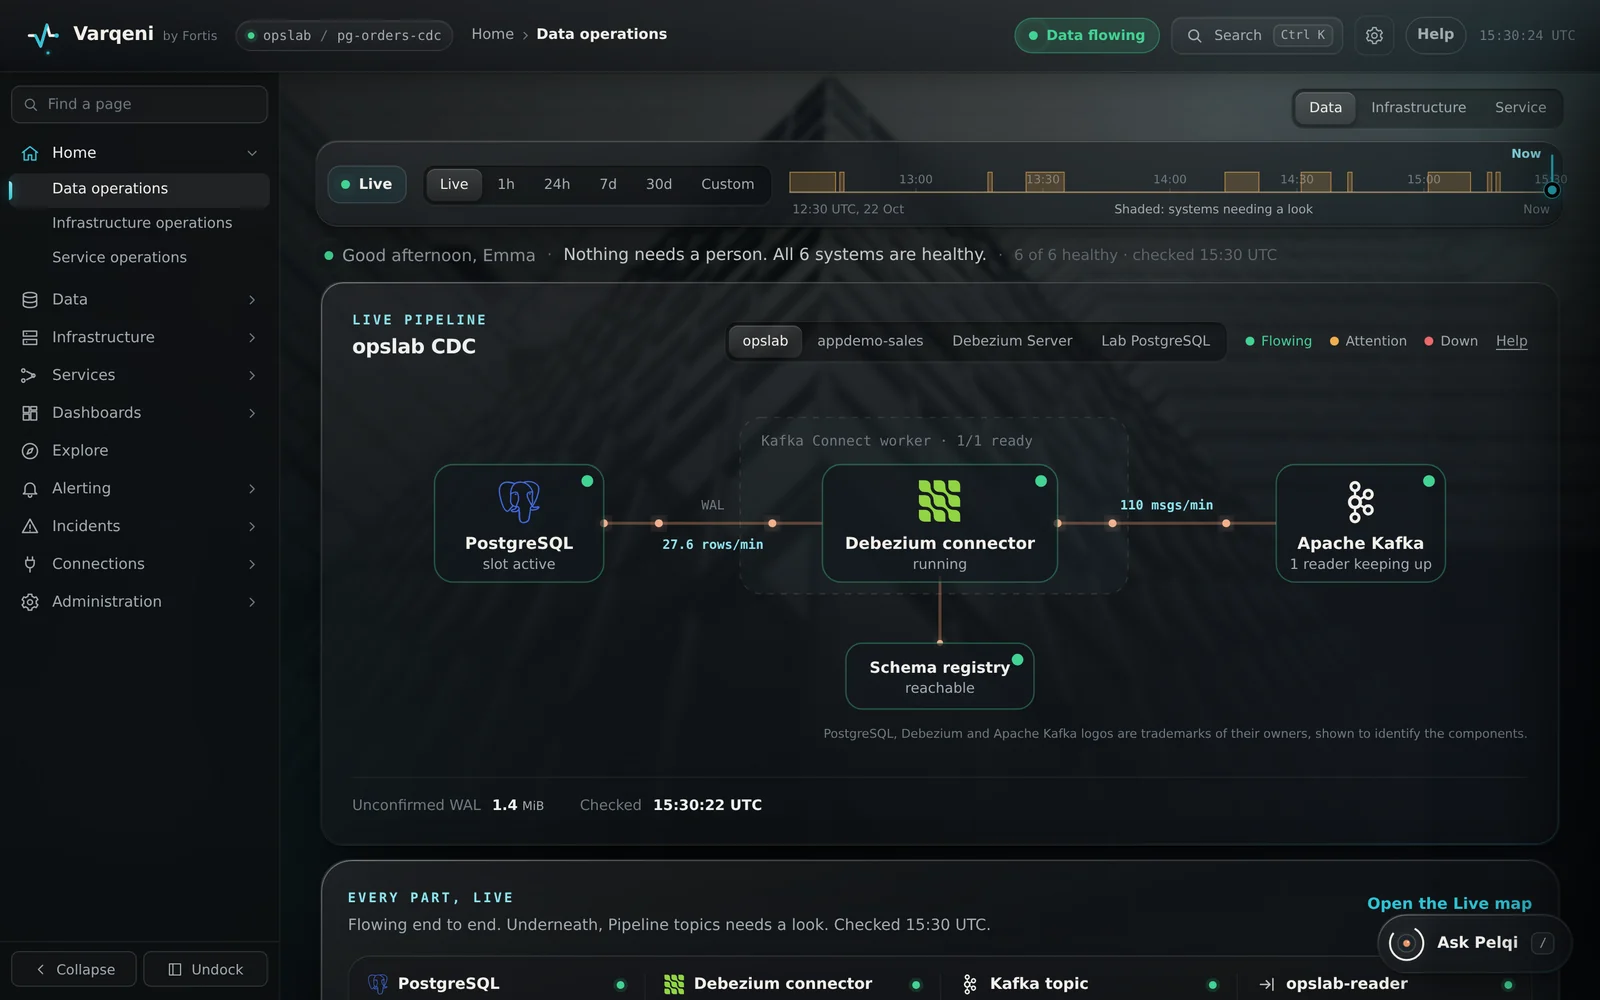
Steps
- Read the status at the top right. Data flowing means every check passed. A count such as 2 signals means something needs a look.
- Read the headline. It says in one sentence what Varqeni sees right now, and the line under it says what it is allowed to do.
- Look at the pipeline. Each part, from PostgreSQL through Debezium to Kafka and the schema registry, shows green, amber or red with a short state.
- Scroll to Investigations. Every investigation Varqeni opened is listed with its cause. Open one to see the evidence.
- Try the views. Actions lists the fixes that ran, Policies shows what Varqeni may do on its own, and Systems lists every pipeline it watches.
- Ask PelQi. Choose Ask PelQi at the bottom right, or press /, and ask whether the pipeline is healthy.
What you should see: Within a few seconds of signing in, the status turns from Connecting to the live state, and the clock at the top right ticks in UTC.
What it can and cannot do
Can
- Show everything Varqeni sees and did, with the evidence, in one console.
- Let the person on call acknowledge an incident and approvers approve its fix, from the incident itself.
Cannot
- Change your systems by looking around. Only the response buttons on an incident do anything, and each is checked again before it acts.
If it does not work
- If the status says Console cannot reach the agent, see Console cannot reach the agent.
Related articles
- Read the status, headline and measuresThe status at the top right and the headline say, at a glance, whether data is flowing and what Varqeni sees.
- Read an investigationOpen an investigation to see the cause of record, the model review, what was ruled out and what a person should do next.
- Ask PelQi a questionPelQi answers questions about what Varqeni sees, from its live evidence, and says when something is not in the evidence.
Still stuck? Contact support or email info@fortisdatagroup.com.