Read the live pipeline
The live pipeline shows your change data capture path as it runs: PostgreSQL, the Debezium connector, the Kafka topic and its readers, with the schema registry under the connector and the platform it all runs on below.
AvailabilityAvailable to everyone with early access to Varqeni.
Steps
- The diagram comes first: PostgreSQL, the Debezium connector inside its Kafka Connect worker, Apache Kafka, and the schema registry under the connector. Each link carries its measured rate, such as 28 rows/min beside WAL, with dots moving along it. Choose a part, or tab to it, for its details; choose the worker's frame for the worker; choose a link to open the pipeline in the Live map. The names above the diagram (opslab, appdemo-sales, Debezium Server, Lab PostgreSQL) choose the system for the diagram and the panel under it together.
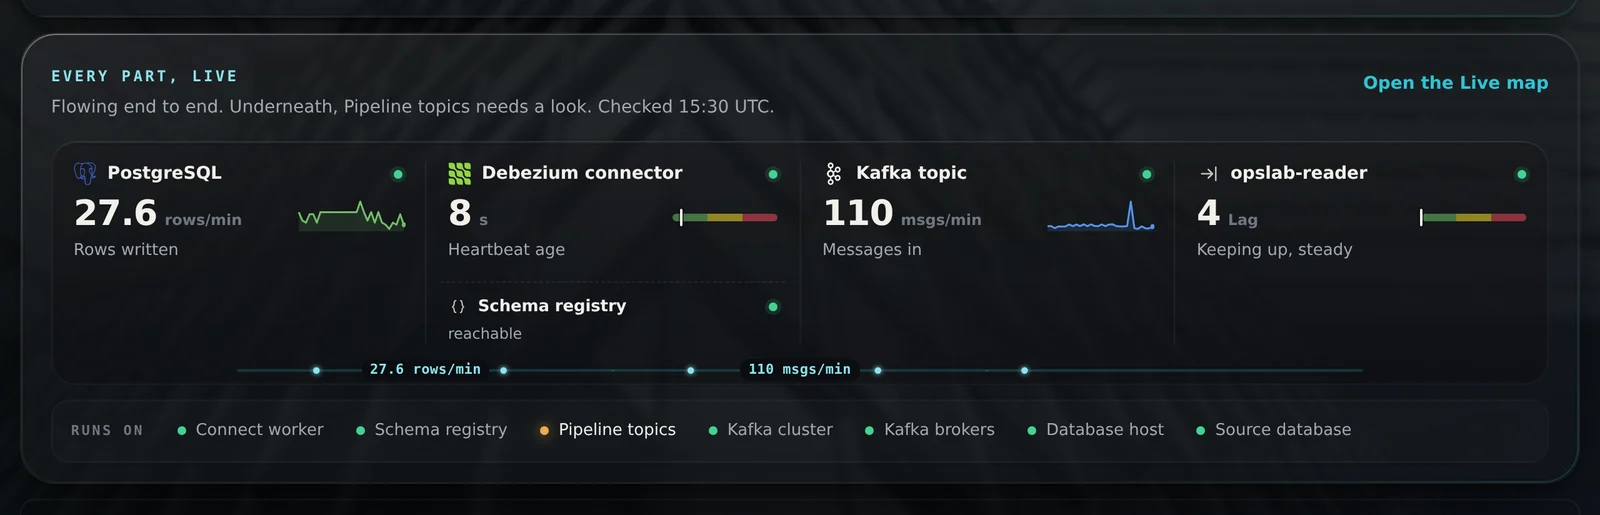
- Under the diagram, each part shows its product mark, its name, one number and a small line of its recent history. PostgreSQL shows the rows written to the watched tables a minute. The connector shows its heartbeat age in seconds, which should stay low. The Kafka topic shows the messages arriving a minute. A reader shows its lag, and whether it is keeping up, catching up or falling behind.
- Between the parts, a line carries the measured rate, such as 28 rows/min into the connector and 108 msgs/min into the topic. Dots move along it faster and closer together when more moves, stop when nothing moves, and pile up in red where the flow breaks.
- Limits. Where a part has a limit set for its pipeline, such as the connector's heartbeat or a reader's lag, a small bar shows green, amber and red zones with a marker at the reading: amber from half the limit, red at the limit.
- Colours. Product marks are in their own colours and each part's history line has its own colour, so you can tell them apart at a glance. A green light is healthy. A part that needs a look glows amber and its line under the name says why; one that has stopped glows red.
- Runs on is the strip under the pipeline: one light for each part of the platform it runs on, such as the Kafka Connect worker, the topics, the brokers and the database host. Point at a part of the pipeline and the lights it runs on light up; point at a light and the parts it carries light up.
- Details. Point at a part, or tab to it, and its details open beside it after a moment: its number and history, the facts Varqeni reads, what feeds it, what it feeds, what it runs on, and when it was last updated. They stay open while the pointer is on the part or on the details, and close a moment after it leaves both. Click or tap a part to pin its details open; Esc, the cross or a click elsewhere closes them. Open in the Live map takes you to it there.
- Choose a pipeline by name above the drawing when Varqeni watches more than one. On a phone the pipeline runs down the screen.
What you should see: The numbers come from what Varqeni already measures to watch for data drift, so they appear a few minutes after a pipeline is first watched. While you look at a past moment on the time bar, the numbers are hidden, since they are live readings. The drawing refreshes every 15 seconds without moving under your pointer.
What it can and cannot do
Can
- Show each part of the pipeline with its key number and recent history, the rate moving between parts, and the platform under it, live.
Cannot
- Change a part from the drawing: it is read-only. Show live numbers for a past moment.
Related articles
- Read the status, headline and measuresThe status at the top right and the headline say, at a glance, whether data is flowing and what Varqeni sees.
- Switch between pipelinesWhen Varqeni watches more than one pipeline, choose which one the console shows.
- A downstream reader stopped or is falling behindVarqeni tells you when something that reads your change data from Kafka stops or keeps falling behind. It does not restart readers.
Still stuck? Contact support or email info@fortisdatagroup.com.