The Reports view
Reports are worked out from what Varqeni already keeps, each time you open them. Nothing is sent anywhere.
AvailabilityAvailable to everyone with early access to Varqeni.
Steps
- In the sidebar, open Incidents and choose Reports, then 7, 30 or 90 days.
- Time to answer a page is from the first page to the first acknowledgement, approval or decline. Time to resolve is from the incident opening to its end. Each shows the median and the time within which 90% fell.
- Settled with nobody woken is the share the autopilot fixed and the share that cleared before anyone was paged.
- Incidents shows each day, split by whether a person was paged. Point at a day for its numbers, or choose Show as a table.
- Noisiest causes, On-call load (pages each person was named on), By severity and Recent incidents follow. Choose a recent incident to open it.
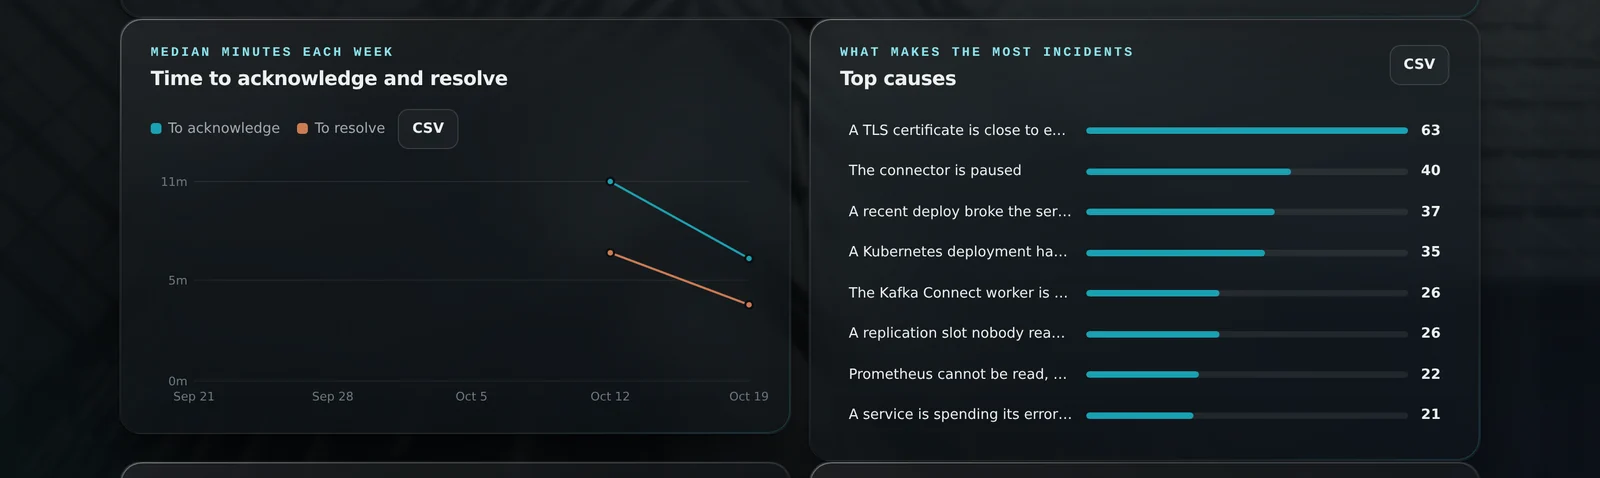
- Trends, from Varqeni's own archive, show the longer view: incidents per system each week, the time to answer and to resolve over the weeks, the top causes, deploys against the failures that followed them (the change failure rate) and how fast each error budget burns. Each chart can be shown as a table and downloaded as CSV. Saved views give a ready answer, such as the incidents in a range with how each one went.
What you should see: The same answer and resolve times are available to your Prometheus as varqeni_mtta_minutes and varqeni_mttr_minutes, for 7 and 30 days.
What it can and cannot do
Can
- Show time to answer and to resolve, what makes noise, how incidents ended and who carried the pager, across every system, and trends over weeks with CSV downloads.
Cannot
- Send reports anywhere, or count incidents from before Varqeni was installed.
Related articles
- Run an incident: declare, severity, command, updates and action itemsDeclare an incident Varqeni has not seen, set how bad it is, say who leads it, post where it stands and keep a list of what to do afterwards.
- The On-call viewWho is on call now, the rules for paging and escalation, and every page with what happened to it.
- The incident timelineEverything that happened in one incident, in order, with who did it: from the first signal to the system being healthy again.
Still stuck? Contact support or email info@fortisdatagroup.com.