The live map
Most data problems start below the data. The live map shows the data and the platform together, so you can see what a fault touches without opening five views.
AvailabilityAvailable to everyone with early access to Varqeni.
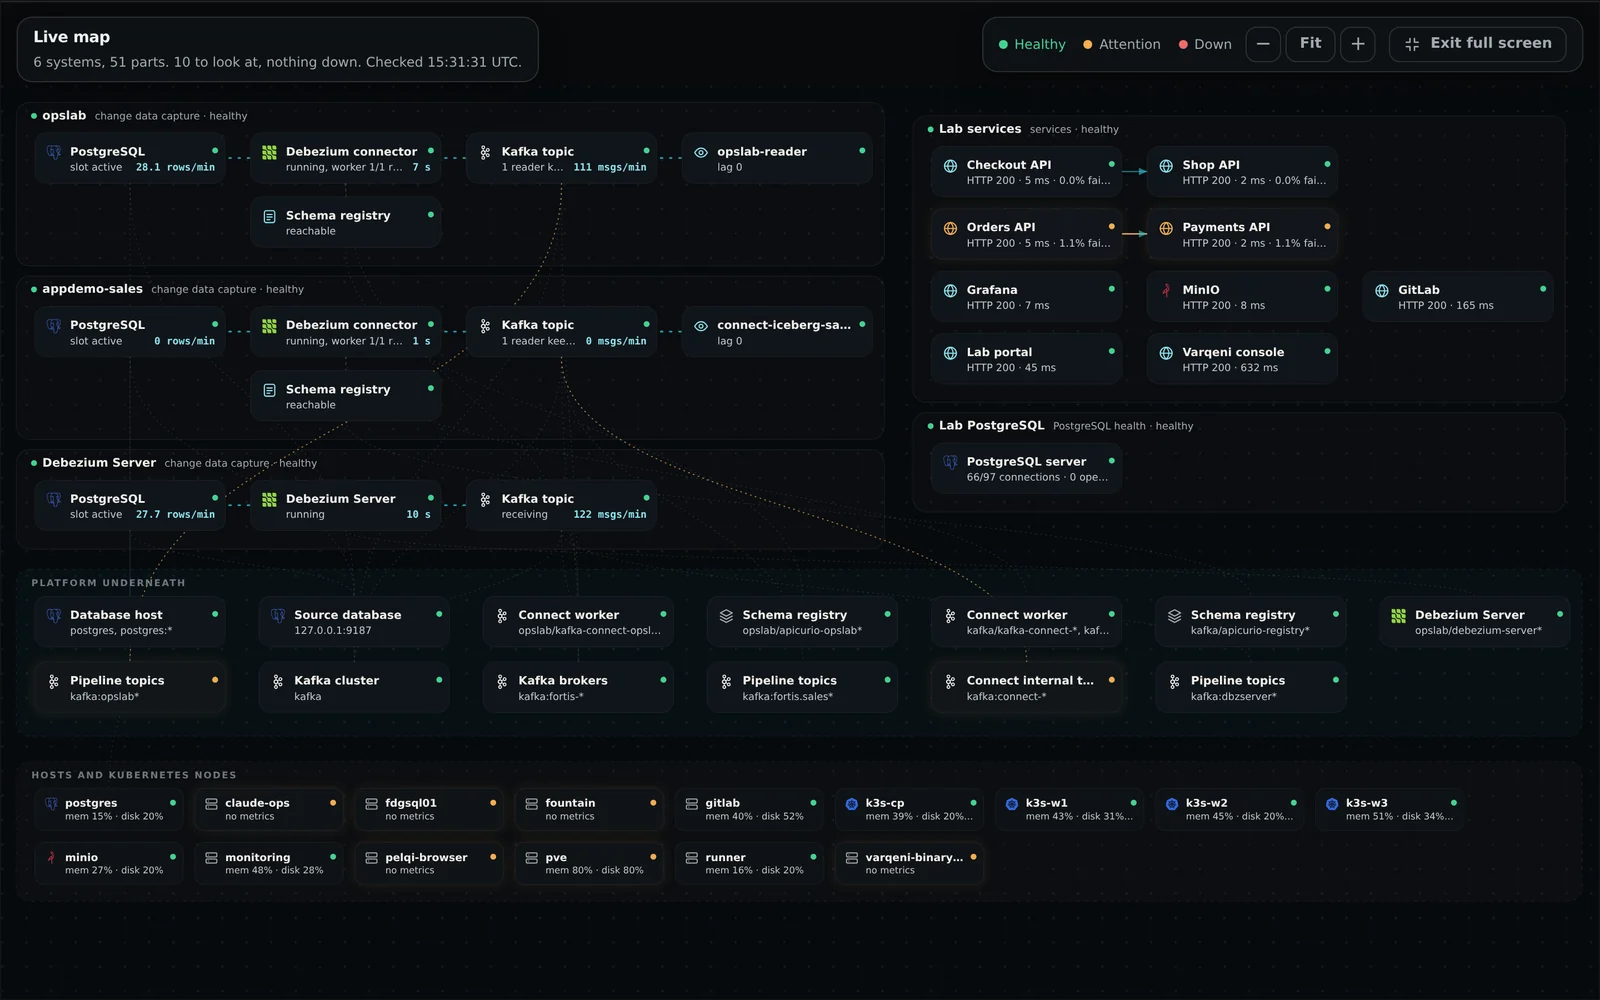
Steps
- In the sidebar, open Data and choose Live map, or press g then m.
- Each pipeline is a lane from left to right: the source database, the change data capture engine, the Kafka topic, its schema registry and the readers downstream. While data flows, the line between them moves. Where it stops, the line breaks at the fault.
- Your services are drawn with an arrow from each service to the ones it calls. The database server sits beside them.
- Under the lanes, Platform underneath shows what each pipeline runs on, as your setup names it: its Kafka Connect worker, registry, topics, the Kafka cluster and the database host. A part that is down there is drawn under the data it carries. At the bottom are the hosts and Kubernetes nodes.
- Point at or tab to a part to light up what it is connected to. Choose it to trace it: everything upstream and downstream stays lit and the rest dims, so you see at a glance what a fault there reaches. For a host or a worker underneath, the trace follows the data that runs on it all the way downstream. Its details open beside the map: its state, how many parts the trace reaches, the facts Varqeni reads, any findings and what it is connected to. Esc closes them.
- When something is down and you have not chosen a part yet, the map brings the fault into view and traces it for you. The map opens on the system you have chosen in the header; the map button on each Pulse row opens it on that system.
- Each part shows its product mark, and a part of a pipeline shows its key number on the right, such as rows or messages a minute. A part that needs a look or has stopped glows amber or red.
- The map opens fitted, with every system in view. Drag to move around. Use + and - or Ctrl with the mouse wheel to zoom, and Fit to see everything again. With the keyboard, Tab and the arrow keys move between parts and Enter opens one.
- Full screen beside Fit gives the map the whole screen, with the legend and zoom on a small bar. Press F while the map has focus to go full screen, and Esc or the same button to come back. It works on phones too.
What you should see: The line under the title counts the systems and parts and says how many are down or need a look, with the time of the last check. It refreshes every 15 seconds.
What it can and cannot do
Can
- Show every watched system's data path, your services, the platform they run on and the hosts underneath, live, open any part, trace what a fault there reaches, and fill the whole screen.
Cannot
- Change anything: the map is read-only, like every view.
If it does not work
- On a phone the map is a list grouped by system, with the platform and the hosts at the end. Choose a part to see its details.
- A platform part shows No data when the estate view could not be read. The data parts above it are unaffected.
Related articles
- The platform underneath a data incidentWhen a pipeline breaks because something it runs on broke, the investigation says so: the node, pod or service underneath, named beside the cause.
- Read the live pipelineThe Overview opens on your pipeline: the diagram first, then a panel with each part's key number, its recent history and the rate moving between parts.
- Read the estate under InfrastructureUnder Infrastructure, the console shows hosts, Kubernetes, data services, Kafka, autoscalers, load balancers, storage pools and certificates, with any findings.
- Read your services under ServiceUnder Service, the console shows each service you use, whether it answers and how fast, how many of its requests fail, which services it calls, your scheduled jobs, and what was deployed in the last 30 minutes.
Still stuck? Contact support or email info@fortisdatagroup.com.